By Jonathan Michael Feldman, August 10, 2023

“Radical hedonism and unlimited egotism could not have emerged as guiding principles of economic behaviour had not a drastic change occurred in the eighteenth century. In medieval society, as in many other highly developed as well as primitive societies, economic behaviour was determined by ethical principles. Thus for scholastic theologians, such economic categories as price and private property were part of moral theology. Granted that the theologians found formulations to adapt their moral code to the new economic demands…nevertheless, economic behaviour remained human behaviour and, hence, was subject to the values of humanistic ethics. Through a number of steps eighteenth-century capitalism underwent a radical change: economic behaviour became separate from ethics and human values. Indeed, the economic machine was supposed to be an autonomous entity, independent of human needs and human will. It was a system that ran by itself and according to its own laws. The suffering of the workers as well as the destruction of an ever-increasing number of smaller enterprises for the sake of the growth of ever larger corporations was an economic necessity that one might regret, but that one had to accept as if it were the outcome of a natural law…[T]he character traits engendered by our socioeconomic system, i.e. by our way of living, are pathogenic and eventually produce a sick person and, thus, a sick society…profound psychological changes in Man [are] an alternative to economic and ecological catastrophe…For the first time in history the physical survival of the human race depends on a radical change of the human heart.”
Erich Fromm, To Have or To Be?, London: Abacus, 1979: 16-17, 19.
Ecocide Champions
One essential question is how various countries contribute to ecocide. This determination might start off by examining various countries’ rankings on ecological indicators. One metric that seems to have achieved high status is the Environmental Performance Index (EPI) which ranks various countries using various indicator systems. Using EPI data for various countries we see that the Netherlands, Germany and Australia are ranked higher than Saudi Arabia, Russia, China, Vietnam and India (Table 1). These indicators seem to be based on nationally-based activities in these nations.
Another indicator system that can be used is based on the emissions contributions of various nations. From 1990 to 2022, we can see that China has now dramatically surpassed the United States as the world’s leading contributor to emissions and thus ecocide (Figure 1). We also see that emissions from India vastly surpass those of Germany (Figure 2). There is a problem with the indicators, however, because even nations with reputations as being ecological leaders (like EPI fifth-ranked Sweden) can have extensive ties with ecocide champions in other nations.
According to one source, Stop Ecocide International, ecocide can be defined as “mass damage and destruction of ecosystems – severe harm to nature which is widespread or long-term.” The Cambridge Dictionary defines the term simply as “destruction of the natural environment of an area, or very great damage to it.” A report in The Guardian explained the definition developed by legal experts: “unlawful or wanton acts committed with knowledge that there is a substantial likelihood of severe and widespread or long-term damage to the environment being caused by those acts.”
Table 1: Country’s Ecological Status According to the Environmental Performance Index
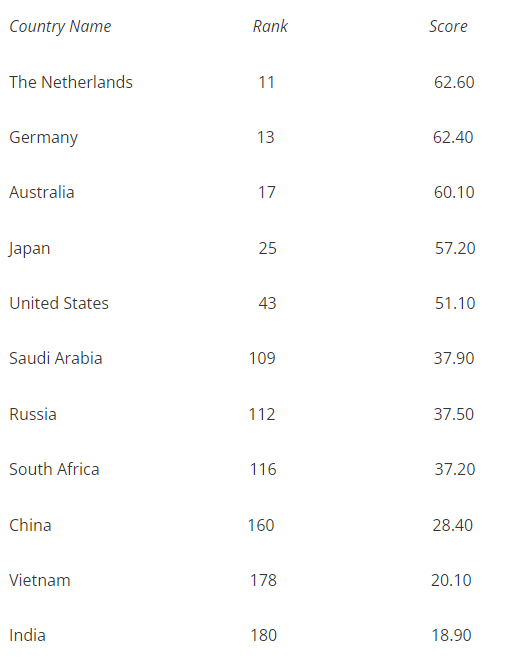
Source: Environmental Performance Index, 2023.
Figure 1: Carbon Dioxide Equivalent Emissions from Energy, Process Emissions, Methane, and Flaring Million tonnes of carbon dioxide equivalent
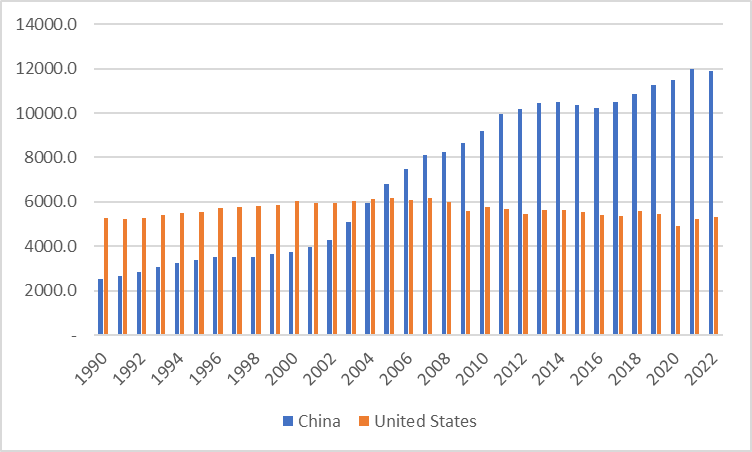
Source: Author based on Energy Institute, 2023.
Figure 2: Carbon Dioxide Equivalent Emissions from Energy, Process Emissions, Methane, and Flaring Million tonnes of carbon dioxide equivalent
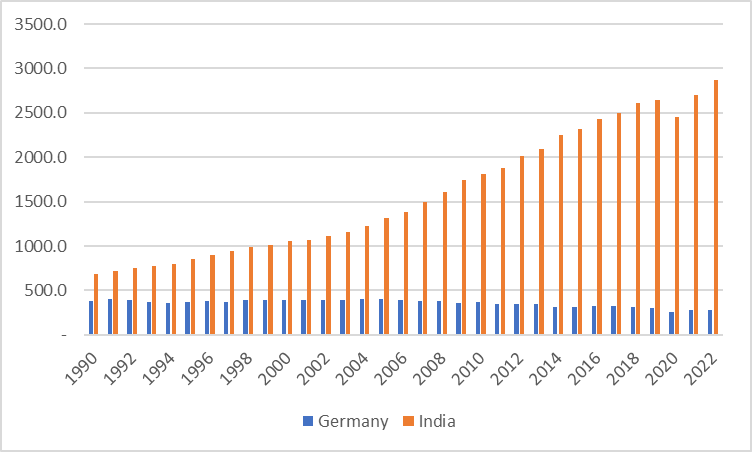
Source: Author based on Energy Institute, 2023.
It would be hard to argue that emissions generation is not part of ecocide; certainly oil and coal production are part of ecocide given their contributions to global warming, climate change and the growing environmental crisis. The United Nations reports the following: “Fossil fuels – coal, oil and gas – are by far the largest contributor to global climate change, accounting for over 75 per cent of global greenhouse gas emissions and nearly 90 per cent of all carbon dioxide emissions. As greenhouse gas emissions blanket the Earth, they trap the sun’s heat. This leads to global warming and climate change. The world is now warming faster than at any point in recorded history. Warmer temperatures over time are changing weather patterns and disrupting the usual balance of nature. This poses many risks to human beings and all other forms of life on Earth.” In contrast to such warnings, Global Coal Production has actually increased in recent years (Figure 3). We learn who the leading coal consumers are in Table 2: China, India, the United States, and Russia. This table shows that nations like Germany and Australia which contribute to ecocide, nevertheless gain high status from the Environmental Performance Index. The United States also is a major ecocide proponent, even exceeding Saudi Arabia in Oil Production, even though the US’s EPI ranking is far ahead of Saudi Arabia’s (Figure 4).
Figure 3: Global Coal Production
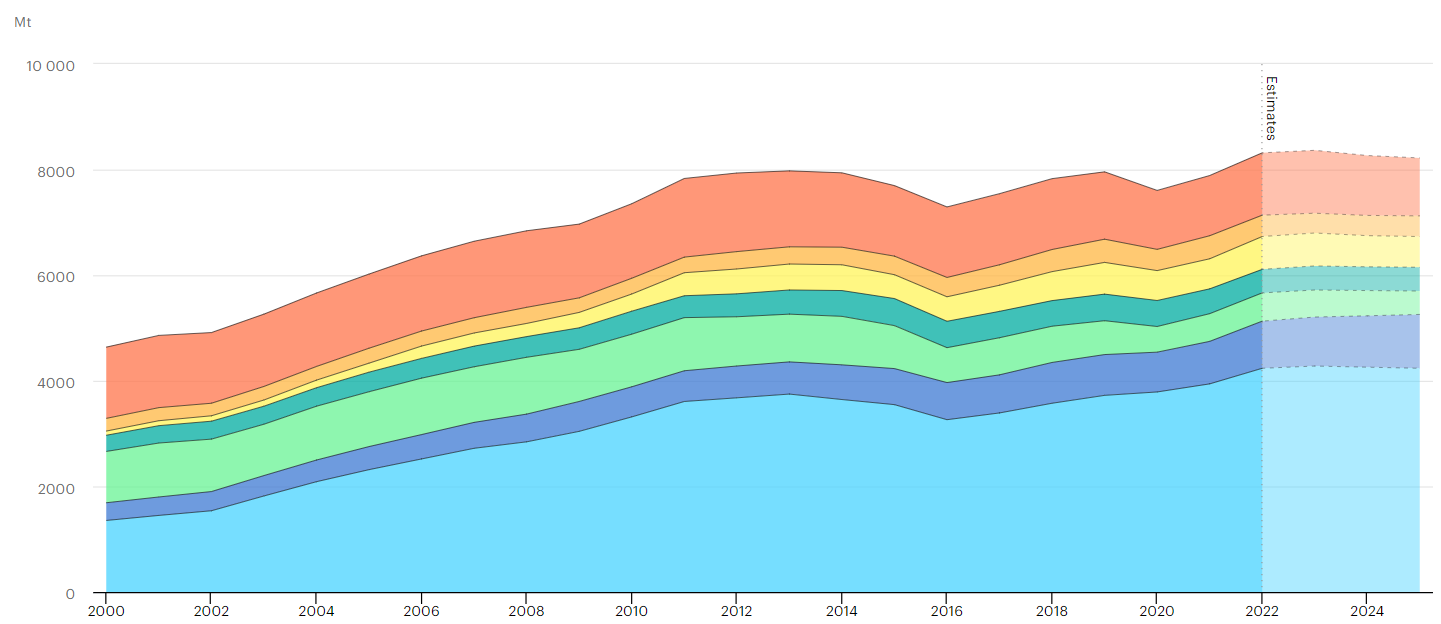
Source: IEA, 2022.
The leading coal consumers have been identified by the World Population Review (Table 2).
Table 2: Ten Countries with the Highest Total Coal Consumption in the World (million cubic feet)
- China — 4,320 trillion MMcf
- India — 966 trillion MMcf
- United States — 731 trillion MMcf
- Germany — 257 trillion MMcf
- Russia — 230 trillion MMcf
- Japan — 210 trillion MMcf
- South Africa — 202 trillion MMcf
- South Korea — 157 trillion MMcf
- Poland — 149 trillion MMcf
- Australia — 130 trillion MMcf
Source: World Population Review, 2023.
Figure 4: Oil Production: Thousand Barrels Daily

Source: Author based on Energy Institute, 2023.
Ecocide and Global Trade Linkages
Last year Herman Daly, the ecological economist and growth critic, explained the ecological costs of trade as follows: “If you try to enact laws for counting the ecological costs of your production in the United States and then you enter into trading relations with another country that does not count the costs, they have a competitive advantage. They may ruin themselves in the long run, but in the short run they’re going to undersell you. This creates huge problems for the free traders because the answer to the problem is to have a tariff to protect the U.S. industry.” In a November 1993 essay published in Scientific American, Daly argued: “The default position should favor domestic production for domestic markets. When convenient, balanced international trade should be used, but it should not be allowed to govern a country’s affairs at the risk of environmental and social disaster. The domestic economy should be the dog and international trade its tail. GATT seeks to tie all the dogs’ tails together so tightly that the international knot would wag the separate national dogs.” Concerns for security of supply is reducing the benefits of cost advantages of global outsourcing in some cases.
While Chinese emissions now exceed those in the United States by a far margin, we must realize that the U.S. contributes to Chinese emissions through its imports from China. U.S. imports from China have actually increased in the recent past as seen in Figure 5. The U.S. is not alone. As seen in Table 3, many nations are vicariously part of the Chinese global warming machine. Daniel Workman has analyzed these statistics as follows. In 2022, China exported $3.6 trillion worth of products globally. This represented “a 44.1% increase compared to $2.494 trillion in 2018.” Compared to 2021, “the overall value of mainland China’s exported goods slowed to a 6.9% rise.” China’s total exports represented 16.2% of global exports. About half of mainland China’s exports (47.4%) were to fellow Asian countries, with European countries representing 20.7% of Chinese exports and North America representing 19.9% of China’s exports. The top contributors to China’s global warming machine were the United States, Japan, South Korea, Vietnam, India, the Netherlands, and Germany. We see clearly how the Environmental Performance Index begs the question of how various nations, particularly Netherlands and Germany with their high EPI ratings, are actually part of the Chinese global warming machine.
Figure 5: United States Annual Goods Imports from China by Trade War Tariff List: Millions of US dollars (current), 2017–22
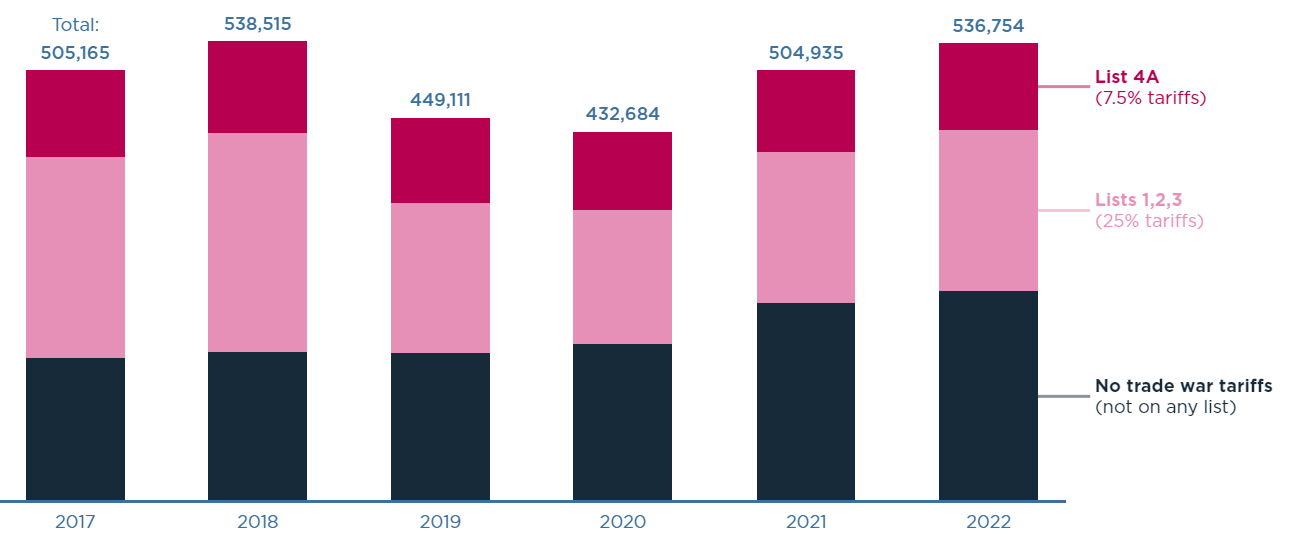
Source: Brown, 2023.
Table 3: China’s Top Fifteen Trading Partners in Terms of Export Sales
- United States: US$582.8 billion (16.2% of China’s total exports)
- Hong Kong: $297.5 billion (8.3%)
- Japan: $172.9 billion (4.8%)
- South Korea: $162.6 billion (4.5%)
- Vietnam: $147 billion (4.1%)
- India: $118.5 billion (3.3%)
- Netherlands: $117.7 billion (3.3%)
- Germany: $116.2 billion (3.2%)
- Malaysia: $93.7 billion (2.6%)
- Taiwan: $81.6 billion (2.3%)
- United Kingdom: $81.5 billion (2.3%)
- Singapore: $81.2 billion (2.3%)
- Australia: $78.8 billion (2.2%)
- Thailand: $78.5 billion (2.2%)
- Mexico: $77.5 billion (2.2%)
Source: Workman, 2023.
Militarism as an Ecocide Accelerator
The resources necessary to accelerate a clean energy, transportation, food and housing transition often require government spending. Yet, governments in Europe and the United States are busy increasing their military budgets, creating an opportunity cost that slows if not retards this transition. The idea that funding can come from elsewhere begs the question of how we could be spending more and faster on the transition if we diverted resources from the military. We certainly should be spending more and faster. Given ecological tipping points, military spending and war mobilization represent the great diversion. The world is on the brink of at least five major ecological tipping points. At the same time, the UN reports that “the international community is falling far short of the Paris goals, with no credible pathway to 1.5°C in place.” Instead, militarists and their allies are on the offensive, helping to facilitate an arms race and conflicts throughout the globe. Turning first to Europe, we see significant increases in military expenditure (Figure 6). The same pattern holds for the United States (Figure 7). Violence against the planet is a byproduct, which debunks the idea of the world becoming more “peaceful.” Therefore, these military budgets represent ecocidal acceleration funds, given the opportunity costs of military spending identified by scholars like Seymour Melman and others, including discussions of the tradeoff between climate and combat budgets.
Figure 6: European Union Military Expenditures in Current U.S. Dollars: 1960-2021
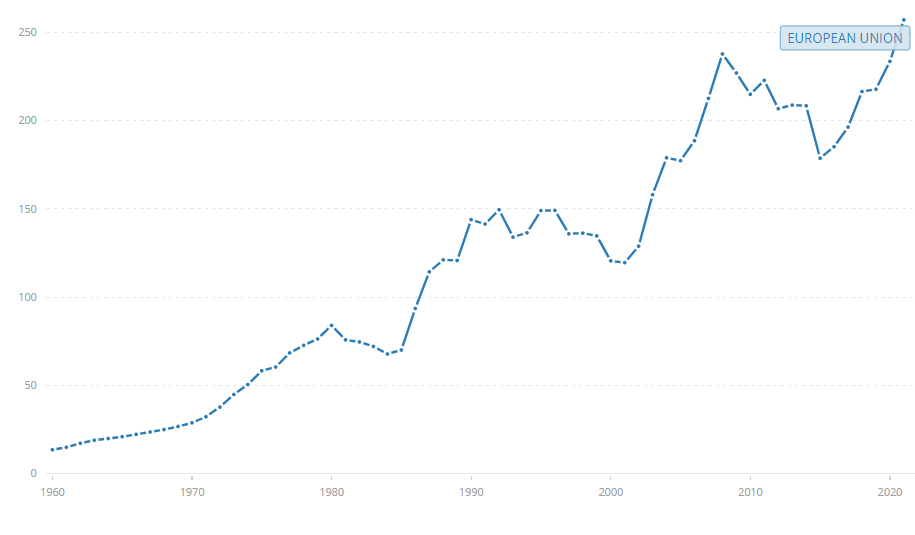
Source: The World Bank (2023).
Figure 7: U.S. Military Spending 2000 to 2022 in Current U.S. Dollars: 2000-2022
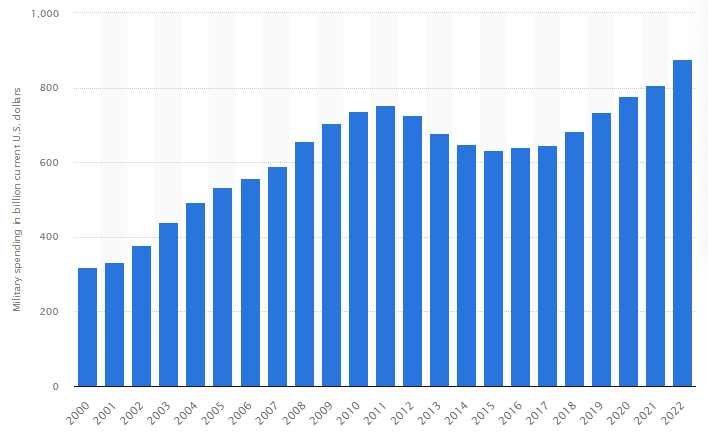
Source: Statista, 2023.
The U.S.-Chinese relations are indicative of a larger problem. The U.S. has absorbed oil profits from Saudi Arabia by exporting weapons to Saudi Arabia in the billions of dollars. From 2015 to 2019, “a total of 73% of Saudi Arabia’s arms imports came from the U.S., and 13% from the U.K.,” according to a report by the Brookings Institution using SIPRI data. Last year, PBS reported that the Biden administration “approved two massive arms sales to Saudi Arabia and the United Arab Emirates to help them defend against Iran.” The deal involved “$5 billion in missile defense and related sales.” Yet, Bruce Reidel at the Brookings Institution argued that these weapons sales contribute to slaughter in Yemen: “The war in Yemen is America’s war. Saudi Arabia has spent a fortune buying arms from America to prosecute a war that has killed almost a quarter of a million people — the world’s worst humanitarian catastrophe in our lifetime. Two American administrations have enabled the war. It’s long past time to stop.” An analysis by Jordan Cohen and Jonathan Ellis Allen at the Cato Institute explained the U.S. connection to Saudi Arabia’s war: “Despite not directly contributing troops to the fighting, the United States has played a pivotal role in the conflict. At least 80 percent of the Saudi pilots who executed these frequent strikes in Yemen received U.S. training. Furthermore, the Kingdom of Saudi Arabia is the United States’ top purchaser of weapons and has been so for the past 10 years.” U.S. military spending helps prop up the Saudi Arabian government thereby helping to repress any elements that might convert rather than simply diversify the Saudi economy’s energy portfolio and investments.
Foreign policy conflicts with states like Iran, Russia and China, help fuel global military spending. In the first case, it is worth noting that in 1953 the U.S. Central Intelligence Agency helped overthrow the democratic regime in Iran. This led to the development of a secular-leaning and modernizing but not fundamentalist authoritarian regime which was later replaced by a fundamentalist, expansionist regional militarist state. In the second case, the U.S.-led or sanctioned NATO expansion helped trigger Russia’s intervention in Ukraine, despite massive propaganda and (in certain European nations) McCarthy-like attacks on those advancing these ideas. As in the Iran case, various U.S. elite forces helped undermine aspects of Russia’s democracy as I have analyzed elsewhere. In the China case, what is interesting is how the Chinese help pay for the U.S. military budget indirectly by purchasing bonds that help finance U.S. debt (which is significantly linked to military spending). In January 2023, the Chinese held $859.4 billion in U.S. treasury securities. The Democratic Party has helped accelerate conflicts with China as Michael T. Klare reported in Le Monde Diplomatique in September of last year: “Nancy Pelosi’s visit to Taiwan has opened a new chasm in US-China relations, sweeping away prospects for cooperation and leaving only intensified military competition with an increased risk of war.” Thus the managerial expansionist warfare state and U.S. elites have helped accelerate military conflicts in three principal regions, even if Iran, Russia, and China have their own indigenous militarist, managerialist expansion drives. In this context, the observations of the Peter G. Peterson Foundation are worth noting: “Defense spending by the United States accounted for nearly 40 percent of military expenditures by countries around the world in 2022, according to recently released figures from the Stockholm International Peace Research Institute (SIPRI). U.S. defense spending increased by $71 billion from 2021 to 2022, in part due to a military aid sent to support Ukraine in its ongoing conflict, and the United States now spends more on defense than the next 10 countries combined (up from outspending the next 9 countries combined in 2021).” Needless to say, the vast destruction created by severe weather incidents will costs billions of dollars to repair, which raises the costs of diversions to military budgets as a way to achieve so-called “security.”
Intellectual Regression
During the New Left period the connections between war and environment were very clear, particularly in countries like the U.S., Sweden, and Germany (when movements were radical and focused on the ecological impacts of war and the link between nuclear energy and weapons). In Europe, some green parties have turned soft on militarism; one can see this by analyzing the details presented in my study of the Swedish case. Various scholars including Barry Commoner and Seymour Melman long made the connection between expansive militarism and ecological depletion. These connections have been taken up by other authors, including Jon Rynn, Brian D’Agostino, Miriam Pemberton, Michael G. Renner, Gregory A. Bischak, and Susan D. Lanier-Graham among others who show how militarism fuels the climate crisis (and vice versa). Noam Chomsky recently explained that “every time we build up our military budget, we’re attacking ourselves.” Yet, the connections between militarism and ecocide have been weak because of a global intellectual deficit which is suggested by a survey of Google Trends data (Figure 8).
Figure 8: Google Trends Data on Searches Related to Militarism (Blue), Global Warming (Red) and Climate Change (Yellow)
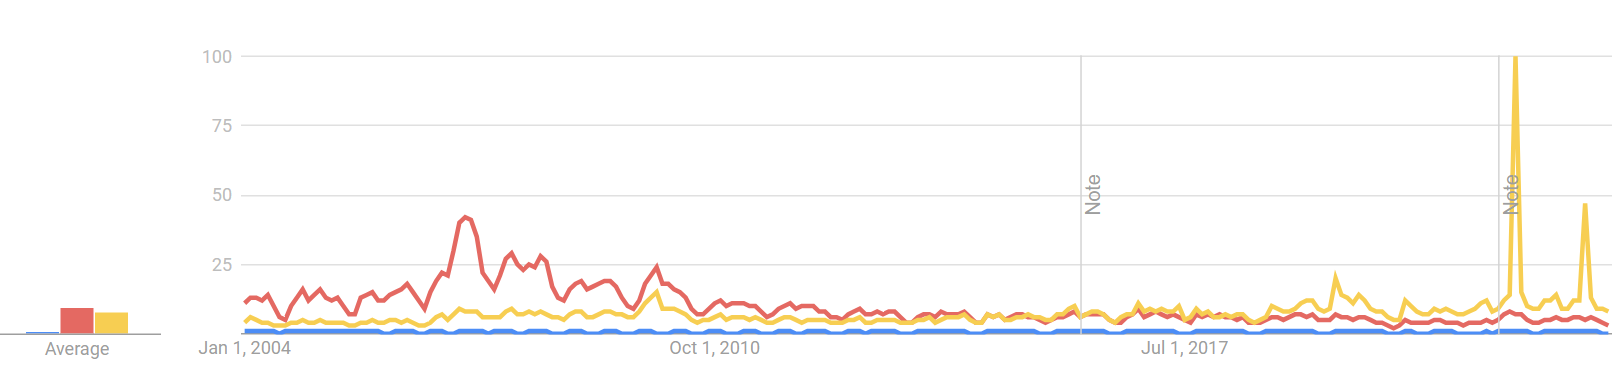
Source: Google Trends, 2023a.
Let us compare four searches in a leading academic database. A Google Scholar search produced (a) 11,700 hits for a search on “militarism ‘global warming,'” (b) 21,900 hits for a search on “‘militarism’ climate change,” (c) the search for “climate change” by itself produced 3,150,000 hits, and (d) the search for “global warming” by itself produced 2,820,00 hits. The ration of (a)/(c) was .371%, the ratio of (a)/(d) was .415%, the ratio of (b)/(c) was .695% and (b)/(d) was .777%. In other words, scholars seem to systematically discuss “global warming” and “climate change” without reference to the concept of militarism. Is the term “militarism” too arcane or constraining? No. The problem looks far worse when we look at other word search combinatoins in Google Scholar: “military budget” “global warming,” only 2,040 hits. Try “defense budget” “global warming” and you get only 2,190 hits. Shift to “military budget” “climate change,” you get 3,840 hits. The combination “defense budget” “climate change” produces only 4,790 hits. In sum, academic scholarship that might, but does not necessarily address, the connection between militiary spending or militarism and the climate emergency is in the distinct minority. Research boards do not make these connections, associations which are not politically expedient given the connections between government patronage and academic research.
It is clear that one first step is to reform or transform the academic, scholarly research agendas of research boards, universities, and their private and public patrons. This requires an organized effort. Such an educational movement might also challenge the arbitrary and misleading rating systems which inflate the ecological profiles of various nations. Finally, the agenda of “free trade,” globalization, and celebration of global “connectedness” contains a very dystopian element as revealed by Herman Daly and the analysis presented here. Therefore, one might also challenge the globalization agenda in academic circles by revealing these constraints.
Selected References
Chad P. Brown. 2023. “US imports from China are both decoupling and reaching new highs. Here’s how.,” Peterson Institute for International Economics, March 31. Accessible at: https://www.piie.com/research/piie-charts/us-imports-china-are-both-decoupling-and-reaching-new-highs-heres-how
Energy Institute, 2023. “Statistical Review of World Energy, 2023.” Accessible at: https://www.energyinst.org/statistical-review
Environmental Performance Index. 2023. The Environmental Performance Index is a joint project of the Yale Center for Environmental Law & Policy and The Center for International Earth Science Information Network (CIESIN) at Columbia University’s Earth Institute. Accessible at: https://epi.yale.edu/ and https://epi.yale.edu/epi-results/2022/component/epi
Google Trends. 2023. Search on “militarism,” “global warming,” and “climate change.” Accessible at: https://trends.google.com/trends/explore?date=all&q=%2Fm%2F01c8vj,global%20warming,climate%20change&hl=en
IEA. 2022. “Coal Market Report,” December. Accessible at: https://www.iea.org/reports/coal-2022
Statista. 2023. “Military spending in the United States from the fiscal year of 2000 to 2022 (in billion current U.S. dollars).” Accessible at: https://www.statista.com/statistics/272473/us-military-spending-from-2000-to-2012/
Daniel Workman. 2023. “China’s Top Trading Partners,” World’s Top Exports. Accessible at: https://www.worldstopexports.com/chinas-top-import-partners/?utm_content=cmp-true
World Bank. 2023. “Military expenditure (current USD) – European Union.” Washington, D.C. Accessible at: https://data.worldbank.org/indicator/MS.MIL.XPND.CD?locations=EU
World Population Review. 2023. “Coal Consumption by Country 2023.” Accessible at: https://worldpopulationreview.com/country-rankings/coal-consumption-by-country